Best practices for creating infographics
September 14, 2015
 Whether you know what they’re called or not, we all consume infographics every day but when it comes to using them to market your own business — what are the best practices for creating infographics?
Most people are a combination of visual, auditory and kinesthetic learners and about 65% of us are mainly visual learners. Visual learners easily pick up information with their eyes. Visual learners often associate the things they learn with the images they saw when they first learned the material.
Why are so many of us visual by nature? The brain processes visual information more quickly than text and it retains more of that information. 90% of information transmitted to the brain is visual and visuals are processed 60,000 times faster in the brain than text.
Back in the good old days of marketing, we used to (and really still do) talk about white space and using fewer words and more graphs, charts and pictures to tell a story. So it shouldn’t surprise any of us that infographics are here to stay.
Infographics take full advantage of the brain’s power to absorb images, which allows the viewer to capitalize on the advantages visuals can have over text.
I’m sure you’ve seen one but just in case — an infographic is a visual representation of information, data and knowledge that is intended to quickly and clearly communicate complex data. It might include maps, charts, diagrams, lists or graphs and usually is a combination of these.
They’re basically a very visually interesting way to tell a story conveying accurate information and data but in a visual form that allows us to get the gist of the message quickly. Think of them as a snapshot of complex data that is easy to read and easy to share in a short amount of time.
They also generate lots of web traffic and for many companies have become valuable marketing tools.
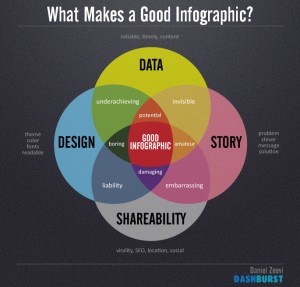
There are many elements to a creative, successful, attention-grabbing infographic. They’re essentially stories containing accurate content, controllable design, easy integration and versatility – all advantages from which marketers can benefit.
Thinking about infusing infographics into your marketing? Here are some things to keep in mind:
Tell A Story: An infographic conveys a story or message as a visual sequence. The creative use of graphics helps people to understand the message or story being delivered and increases retention.
Incorporate Insightful Data: A key element of most infographics is statistical data. Viewers are drawn to statistics so make sure they’re accurate. A single inaccurate statistic will damage the credibility of the entire piece and worse — your company.
A Brand Builder: Infographics are great for creating brand awareness, so be sure it accurately reflects your brand. Your graphics should inviting viewers to investigate your website or company a little more. Be sure you have content to satisfy their interest when they get to your website.
Another benefit of this tool is brand recall. Readers of the infographic are not only more aware of your brand but will also recall it better, which may help influence decision-maker purchase consideration. Research shows that the action of sharing increases brand recall by 63%.
Make It Easy to Share: These visual tools are easily shared on websites, blogs and social networks. Make sure you give people a way to embed your infographic to generate more traffic, views and shares. A strong effort will earn your site a lot of inbound links and give you a big SEO boost.
Credibility: Through the use of accurate data, statistics, insights and references, your infographic builds credibility and demonstrates your expertise in a very unique way. It not only uses a variety of statistics and facts to reduce a complex data set to a manageable and eye catching visual representation – but it also enhances your reputation as a thought leader.
As you begin (or continue) to work on using visuals in your marketing efforts be sure you bake in these best practices for creating infographics so you maximize the incredible benefits of this communications tool. For some more examples — check out these 11 infographics on what makes a good infographic!
More